1.2. Composing multi-panel figures
As I already explained in the previous tutorial, creating figures programmatically has many advantages. However, obtaining a complex layout only by scripting can be very time consuming and even distressing. Therefore, the possible gains can be crippled by the time spent tweaking the programs to obtain optimal results and under time pressure many of us resort to visual editors. One way to alleviate the problem is to use a library with little boilerplate code and which simplifies the common tasks (such as inserting a new panel and adjusting its position). That’s why I introduced the compose module, which is a wrapper around the low-level API described in Creating plublication-quality figures.
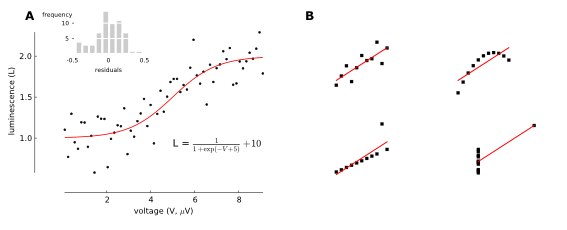
Let’s take the example from the previous tutorial
To obtain this nicely-formatted final figure we needed a considerable amount of code.
The same effect could be achieved in compose with fewer lines of code:
#!/usr/bin/env python
#coding=utf-8

from svgutils.compose import *

Figure("16cm", "6.5cm",
        Panel(
              SVG("sigmoid_fit.svg"),
              Text("A", 25, 20, size=12, weight='bold')
             ),
        Panel(
              SVG("anscombe.svg").scale(0.5),
              Text("B", 25, 20, size=12, weight='bold')
             ).move(280, 0)
        ).save("fig_final_compose.svg")
The compose module offers the same functionality as the transform, but
rather than being based on procedural description of the figure it attempts
declarative approach. The code defining the figure mimics a hierarchical
structure typical of most figures: A figure contains multiple panels; these panels can in
turn contain several graphical elements such as text, markers or other
(sub-)panels.
1.2.1. Defining a figure
Before we start we need to import the definitions from svgutils.compose module:
from svgutils.compose import *
In compose the top-most element is the Figure() object. To create a figure we need to specify
its size (width and height) and its contents. For example, to create a figure consisting of a single
imported SVG file we might write:
Figure("16cm", "6.5cm",
       SVG("sigmoid_fit.svg")
       )
This will create a 16-by-6.5 cm figure with showing the sigmoid_fit.svg file.
Note that the dimensions can be defined together with units supported by SVG
(so far “px” and “cm” are implemented). If no units are defined it defaults
to “px”. SVG() is another object from compose module, which simply
parses and pastes the content of a SVG file into the figure.
The Figure() object also defines several methods; the save() method
saves the figure in a SVG file:
Figure("16cm", "6.5cm",
       SVG("sigmoid_fit.svg")
       ).save("fig1.svg")

1.2.2. Adding annotations
The simple example of previous section is superfluous, because it does not modify the sigmoid_fit.svg
file apart from changing its size. Let us try then overlaying some text on top of the figure.
In compose we can add text using Text() object:
Figure("16cm", "6.5cm",
        Text("A", 25, 20),
        SVG("sigmoid_fit.svg")
       )
In addition to the text itself we defined the $x$ and $y$ coordinates of the text element in pixel units. We can also add additional style arguments – to increase the font size and change to bold letters we can use:
Figure("16cm", "6.5cm",
        Text("A", 25, 20, size=12, weight='bold'),
        SVG("sigmoid_fit.svg")
       )

1.2.3. Arranging multiple elements
We can combine multiple SVG drawings by simply listing them inside the Figure() object:
Figure("16cm", "6.5cm",
       SVG("sigmoid_fit.svg"),
       SVG("anscombe.svg")
       )
The problem with this
figure is that the drawings will overlap and become quite unreadable. To avoid it
we have to move figure elements. To do that automatically you
can use tile() method of Figure(), which arranges the elements
on a regular two-dimensional grid. For example, to arrange the two SVG elements
in a single row we might use:
 Figure("16cm", "6.5cm",
        SVG("sigmoid_fit.svg"),
        SVG("anscombe.svg")
        ).tile(2, 1)
The second figure (anscombe.svg) does not fit entirely in the figure so
we have to scale it down. For this aim each element of the Figure exposes a scale()
method, which takes the scaling factor as its sole argument:
Figure("16cm", "6.5cm",
       SVG("sigmoid_fit.svg"),
       SVG("anscombe.svg").scale(0.5)
       ).tile(2, 1)

For more control over the final figure layout we can position the
individual elements using their move() method:
 Figure("16cm", "6.5cm",
        SVG("sigmoid_fit.svg"),
        SVG("anscombe.svg").move(280, 0)
        )
This will move the ansombe.svg 280 px horizontally. Methods can be also
chained:
Figure("16cm", "6.5cm",
       SVG("sigmoid_fit.svg"),
       SVG("anscombe.svg").scale(0.5)
                          .move(280, 0)
       )
It’s often difficult to arrange the figures correctly and it can involve mundane
going back and fro between the code and generated SVG file. To ease the process
compose offers several helper objects: The Grid() object generates a grid of
horizontal and vertical lines labelled with their position in pixel units. To
add it simply list Grid() as one of Figure() elements:
 Figure("16cm", "6.5cm",
        SVG("sigmoid_fit.svg"),
        SVG("anscombe.svg").scale(0.5)
                           .move(280, 0),
        Grid(20, 20)
        )
The two parameters of Grid() define the spacing between the vertical and
horizontal lines, respectively. You can use the lines and numerical labels to
quickly estimate the required vertical and horizontal shifts of the figure
elements.
1.2.4. Grouping elements into panels
Figures prepared for publications often consist of sub-panels, which can
contain multiple elements such as graphs, legends and annotations (text, arrows
etc.). Although it is possible to list all these elements separately in the
Figure() object, it’s more convenient to work with all elements belonging to
a single panel as an entire group. In compose one can group the elements
into panels using Panel() object:
Figure("16cm", "6.5cm",
       Panel(
          Text("A", 25, 20),
          SVG("sigmoid_fit.svg")
          ),
       Panel(
          Text("B", 25, 20).move(280, 0),
          SVG("anscombe.svg").scale(0.5)
                             .move(280, 0)
          )
       )
Panel() just like a Figure() object takes a list of elements such as
text objects or SVG drawings. However, in contrast to Figure() it does not
allow to define the size and does not offer save() method. The two Panel()
objects of this example contain each a text element and a SVG file.
In this example the Panel()
object serve no other role than grouping elements that refer to a single panel
– it may enhance the readability of the code generating the figure, but it does
not simplify the task of creating the figure. In the second Panel() we apply
twice the method move() to position both the text element and the SVG. The
advantage of Panel() is that we can apply such transforms to the entire
panel:
Figure("16cm", "6.5cm",
       Panel(
          Text("A", 25, 20),
          SVG("sigmoid_fit.svg")
          ),
       Panel(
          Text("B", 25, 20),
          SVG("anscombe.svg").scale(0.5)
          ).move(280, 0)
       )
This way we simplified the code, but also the change allows for easier
arrangement of the panels. An additional advantage is that the tile() method
will automatically arrange the entire panels not the individual elements.